Fix High Memory and CPU Usage in Rclone Transfers with RcloneView
Rclone transfers eating up all your RAM or pinning your CPU at 100%? RcloneView makes it easy to identify the cause and tune performance settings without memorizing command-line flags.
If you have noticed your system slowing to a crawl during cloud transfers, you are not alone. Rclone is powerful, but its default settings or misconfigured options can consume significant system resources -- especially when dealing with large file counts, mounted drives, or parallel transfers. The symptoms are familiar: fans spinning up, applications becoming unresponsive, and transfers that seem to use more resources than they should.
The good news is that most high-resource scenarios have straightforward fixes. This guide walks through the most common causes of excessive memory and CPU usage in rclone and shows you how to resolve them using RcloneView's visual configuration tools.
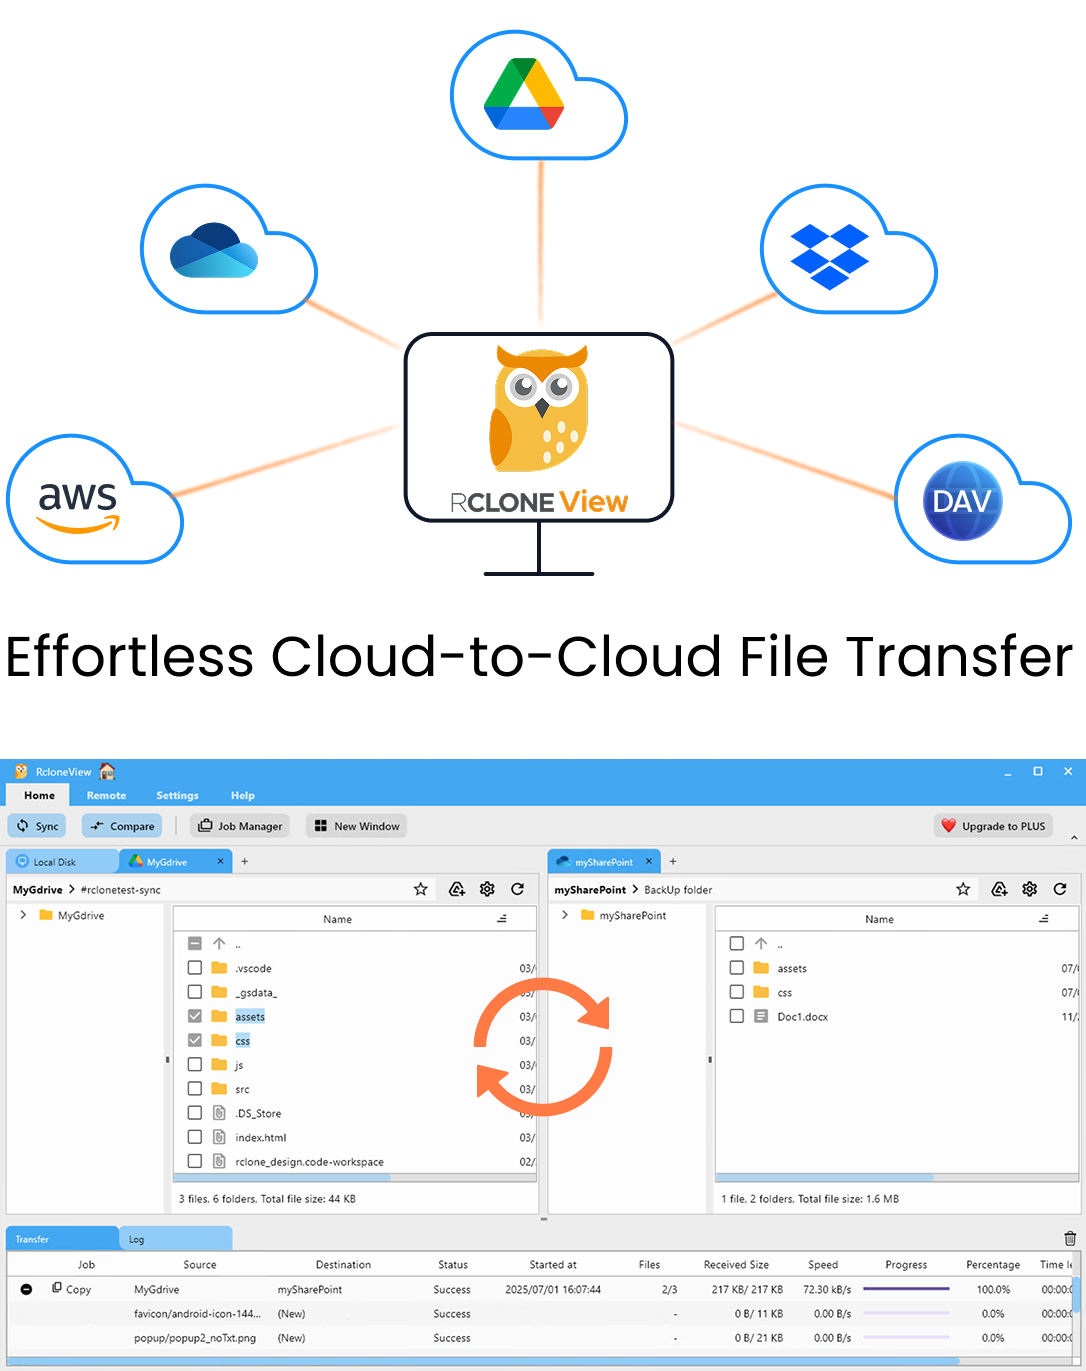
Manage & Sync All Clouds in One Place
RcloneView is a cross-platform GUI for rclone. Compare folders, transfer or sync files, and automate multi-cloud workflows with a clean, visual interface.
- One-click jobs: Copy · Sync · Compare
- Schedulers & history for reliable automation
- Works with Google Drive, OneDrive, Dropbox, S3, WebDAV, SFTP and more
Free core features. Plus automations available.
Common Symptoms
Before diving into solutions, here is what high resource usage typically looks like during rclone operations:
- High RAM usage: rclone process consuming 1 GB or more of memory, sometimes growing continuously until the system runs out.
- CPU spikes: one or more CPU cores pegged at 100% during transfers, especially when listing large directories.
- System unresponsiveness: other applications freezing or lagging while rclone runs.
- Transfer failures: out-of-memory errors causing transfers to abort unexpectedly.
- Slow performance: paradoxically, too many parallel operations can slow everything down due to resource contention.
Too Many Concurrent Transfers and Checkers
The most common cause of high resource usage is running too many parallel transfers and checkers. Rclone defaults to 4 transfers and 8 checkers, but users often increase these numbers thinking it will speed things up. Running 32 or 64 concurrent transfers can overwhelm both your system and your network connection.
How to fix it in RcloneView:
When creating or editing a sync job, set the --transfers flag to a reasonable value. Start with 4 and increase only if your bandwidth and system can handle it. Set --checkers to 8 or lower. For most home connections, 2-4 transfers and 4-8 checkers strike the right balance between speed and resource consumption.
Large File Lists and Directory Scanning
When rclone scans directories with hundreds of thousands or millions of files, it builds an in-memory list of every file and its metadata. This can consume gigabytes of RAM on very large directories.
How to fix it:
- Use
--fast-listwhere supported. This flag fetches directory listings in fewer API calls, which can actually reduce memory usage for some providers (like S3) while increasing it for others. Test with your specific provider. - Break large sync jobs into smaller chunks by targeting specific subdirectories rather than syncing an entire cloud account at once.
- Use filter rules (
--include,--exclude) to limit the scope of each sync operation. Fewer files to list means less memory consumed.
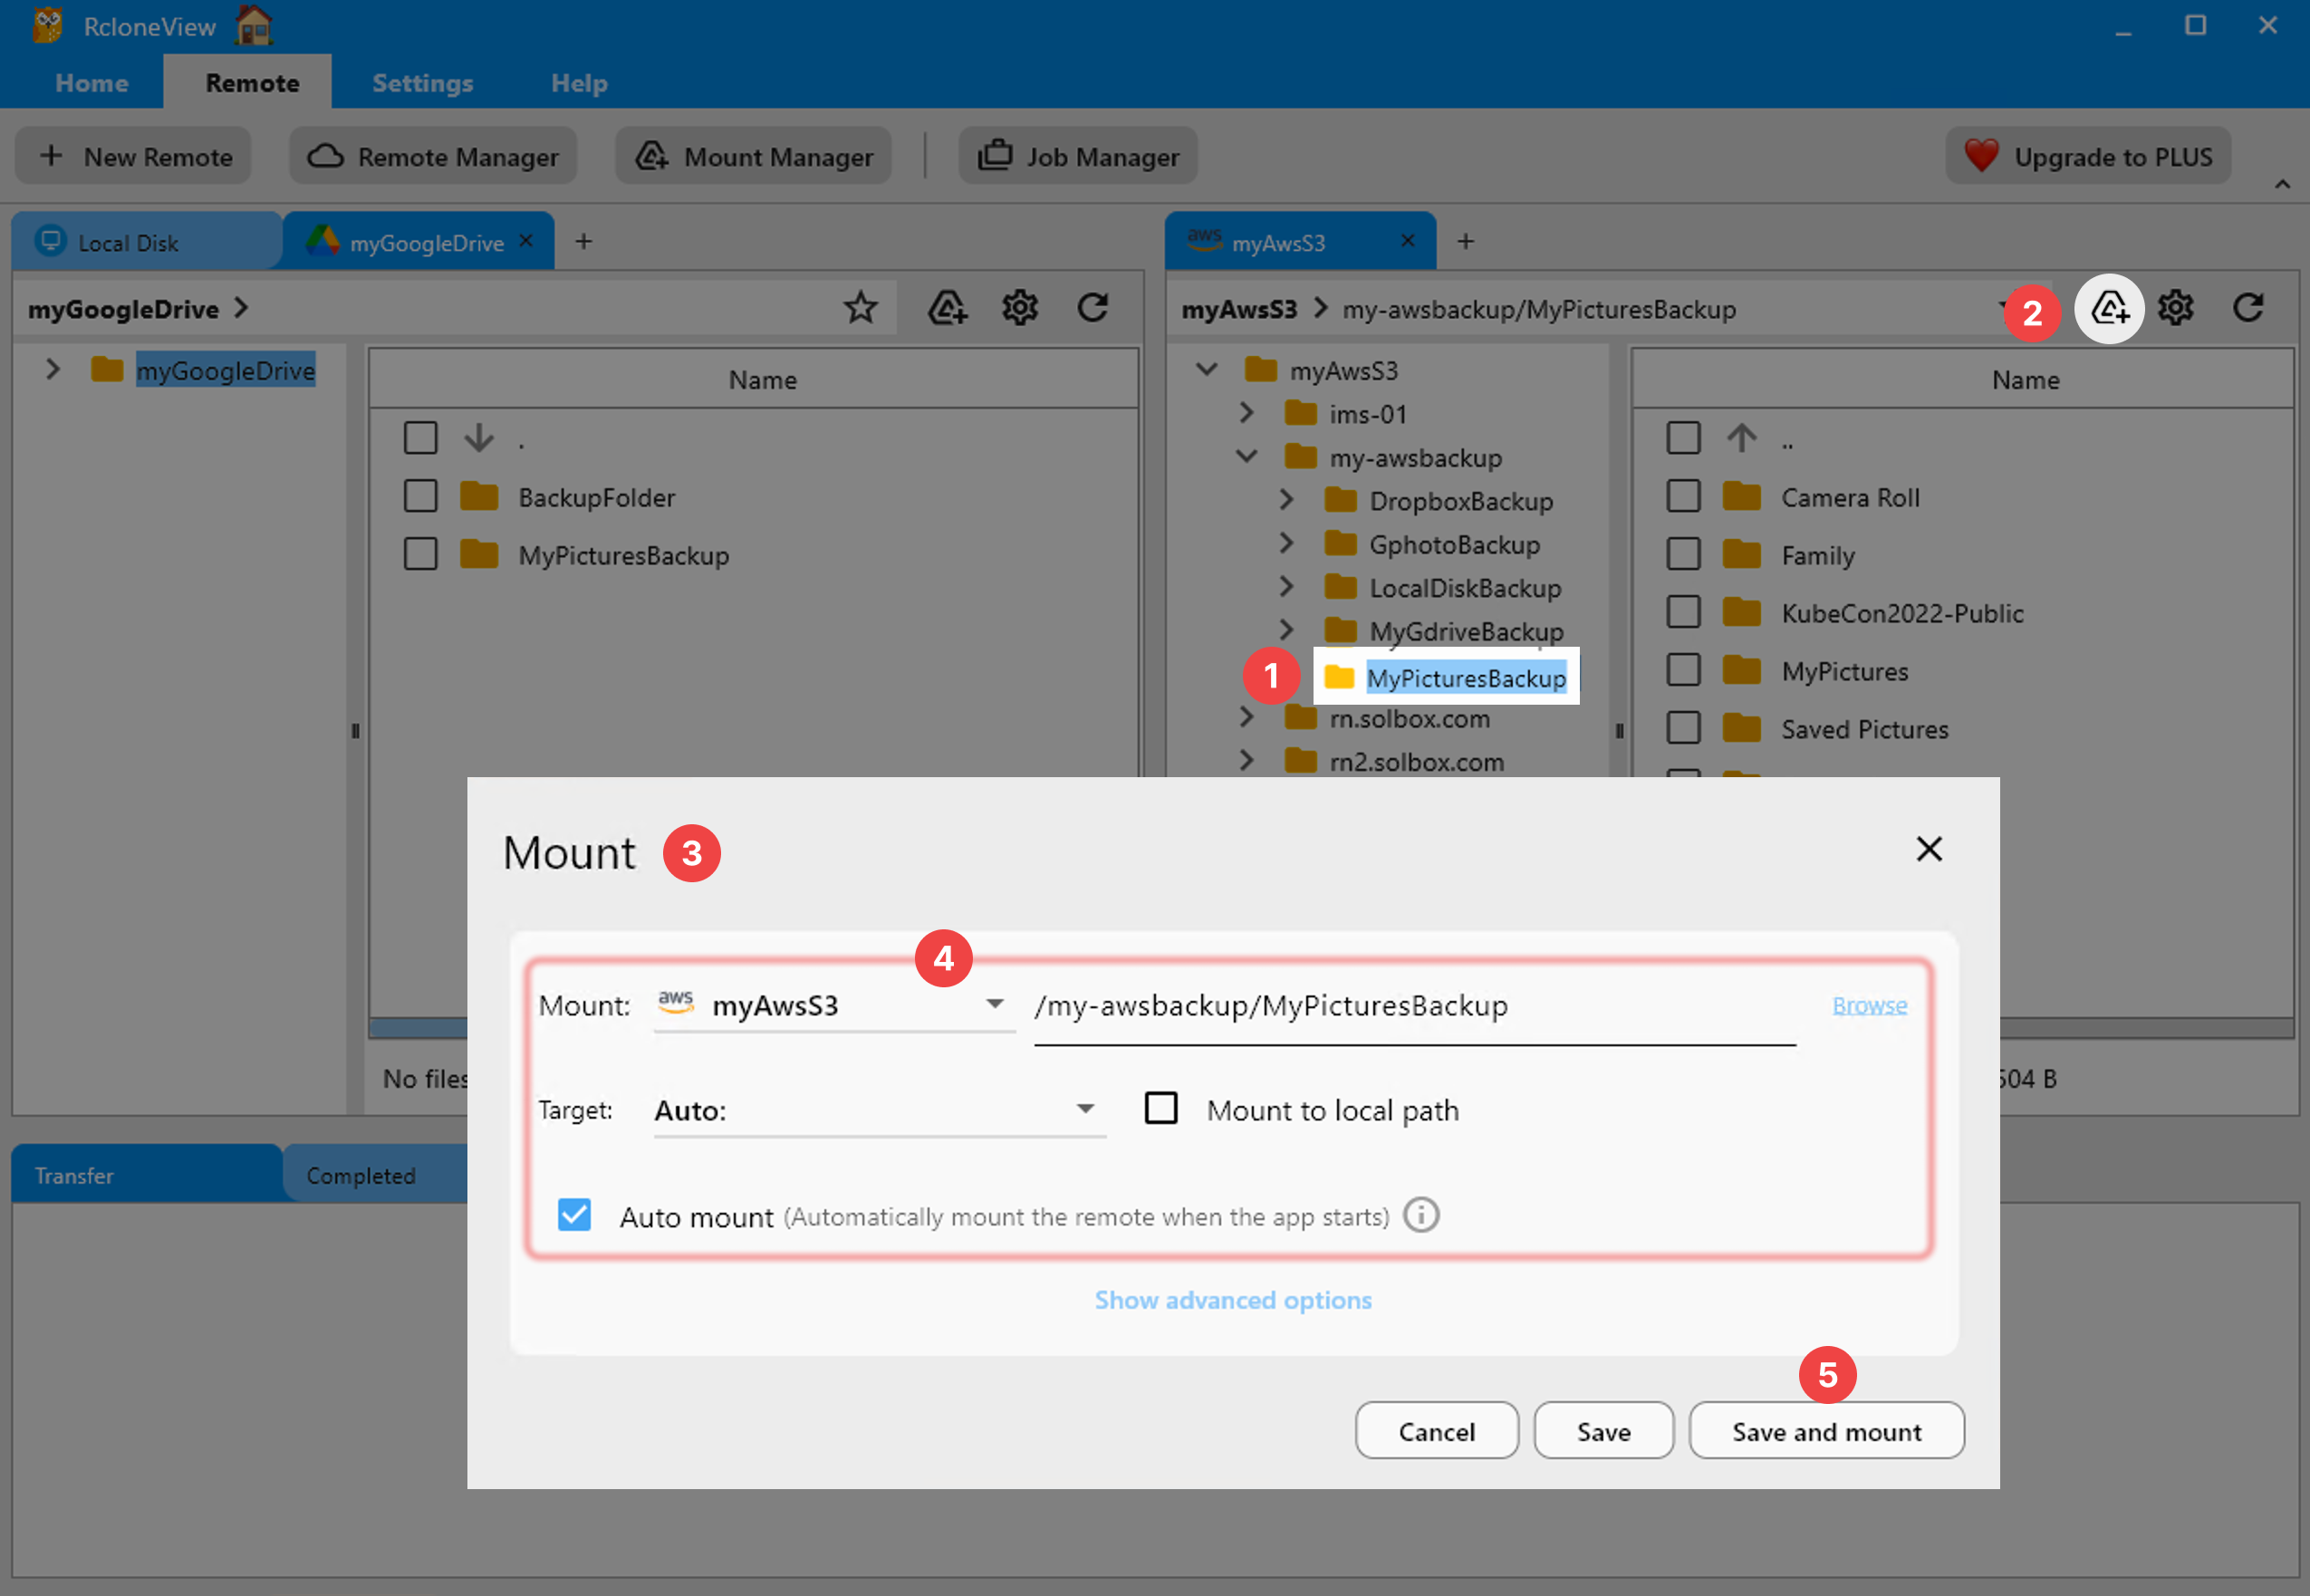
VFS Cache Bloat from Mounted Drives
If you are mounting cloud storage as a local drive, the VFS (Virtual File System) cache can grow significantly. By default, rclone may cache large amounts of data to provide smooth read/write performance on mounted drives. Over time, this cache can consume substantial disk space and memory.
How to fix it:
- Set
--vfs-cache-max-sizeto a reasonable limit, such as1Gor5G, depending on your available resources. - Set
--vfs-cache-max-ageto automatically clean up old cached files. A value like1hor4hworks well for most workflows. - Choose the right
--vfs-cache-mode. Useminimalorwritesinstead offullif you only need read access or occasional writes. Full cache mode caches entire files before they are accessible, which uses the most memory and disk.
Buffer Size Misconfiguration
The --buffer-size flag controls how much memory rclone allocates per file for buffering during transfers. The default is 16 MB per transfer. If you are running 16 concurrent transfers, that is 256 MB of buffer memory alone. Increasing --buffer-size to 256 MB with 16 transfers would consume 4 GB just for buffers.
How to fix it:
- Keep
--buffer-sizeat the default16Munless you have a specific reason to increase it. - If you increased it for large file transfers, reduce
--transfersproportionally to stay within your available RAM. - For systems with limited RAM (4 GB or less), consider reducing
--buffer-sizeto8Mor even4M.
Mount Overhead and FUSE Operations
Mounted drives add CPU overhead because every file operation (open, read, write, stat) goes through the FUSE layer and triggers API calls. Applications that aggressively scan directories -- such as antivirus software, thumbnail generators, or search indexers -- can cause continuous CPU and API usage on mounted drives.
How to fix it:
- Exclude mounted drive paths from antivirus scanning.
- Disable thumbnail generation for mounted drives in your file explorer settings.
- Use
--dir-cache-timeto increase the duration directory listings are cached (e.g.,5mor30m), reducing repeated API calls. - Set
--attr-timeoutto cache file attributes longer, which reduces stat calls. - If you only need to read files, use
--read-onlyto prevent write-related overhead.
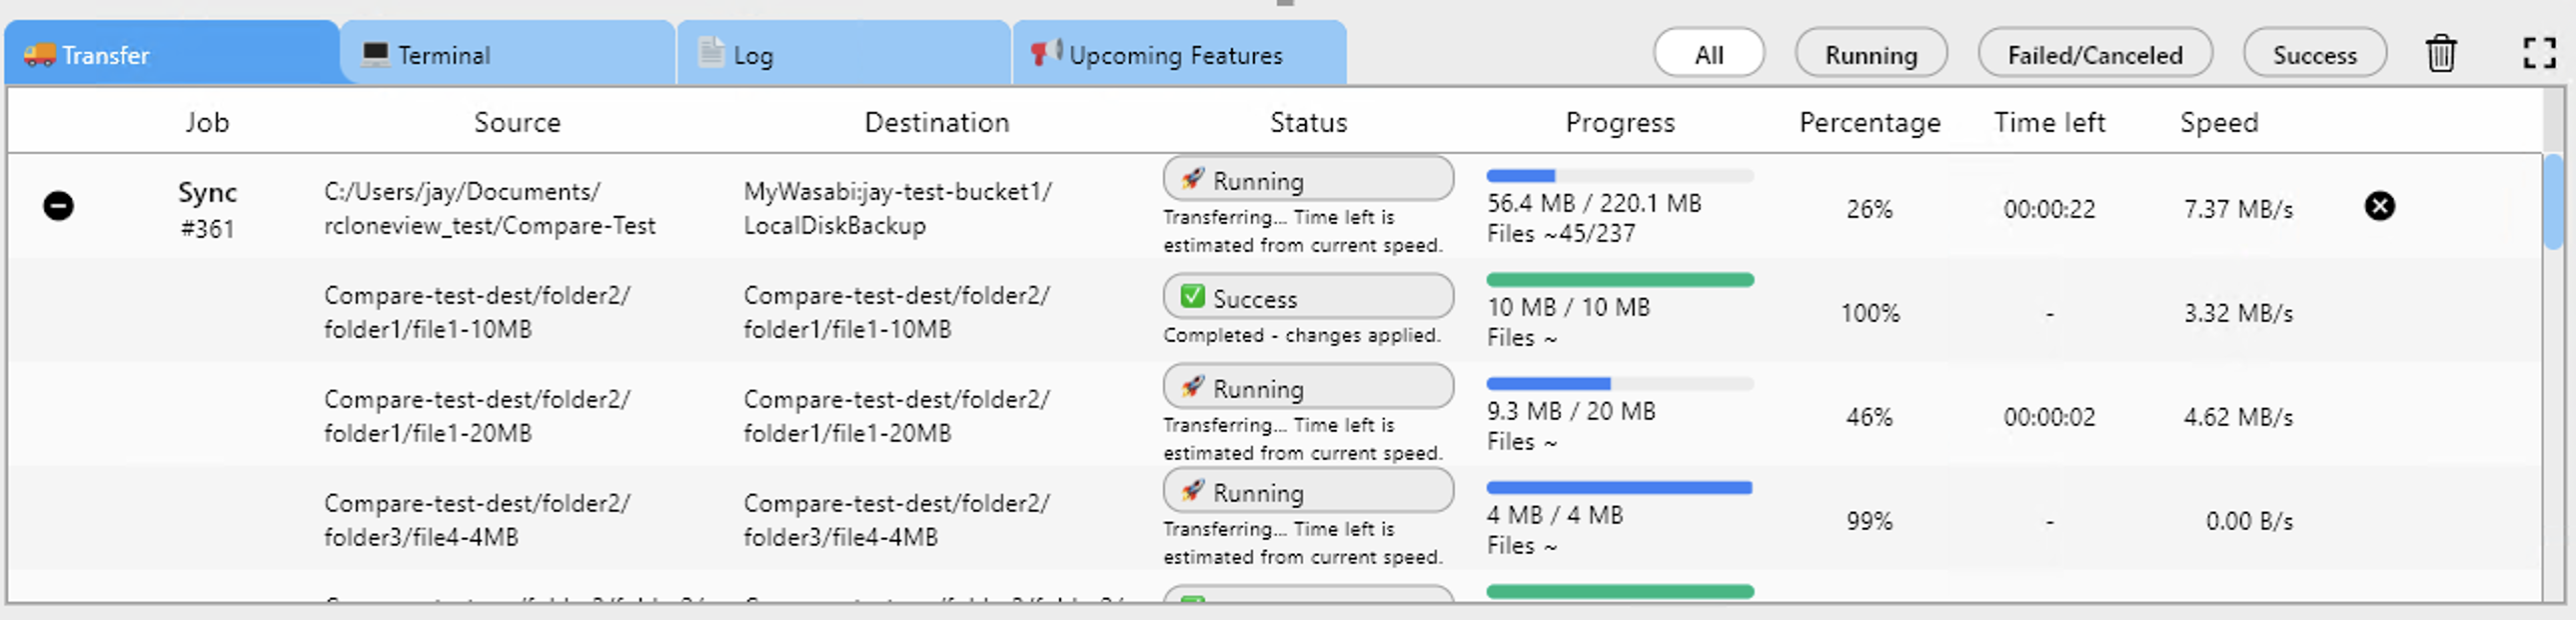
Monitoring Resource Usage in RcloneView
RcloneView provides real-time transfer monitoring that helps you identify when resources are being consumed excessively. During an active transfer, you can observe transfer speeds, file counts, and overall progress. If speeds drop or the interface becomes sluggish, that is a sign to reduce parallelism.
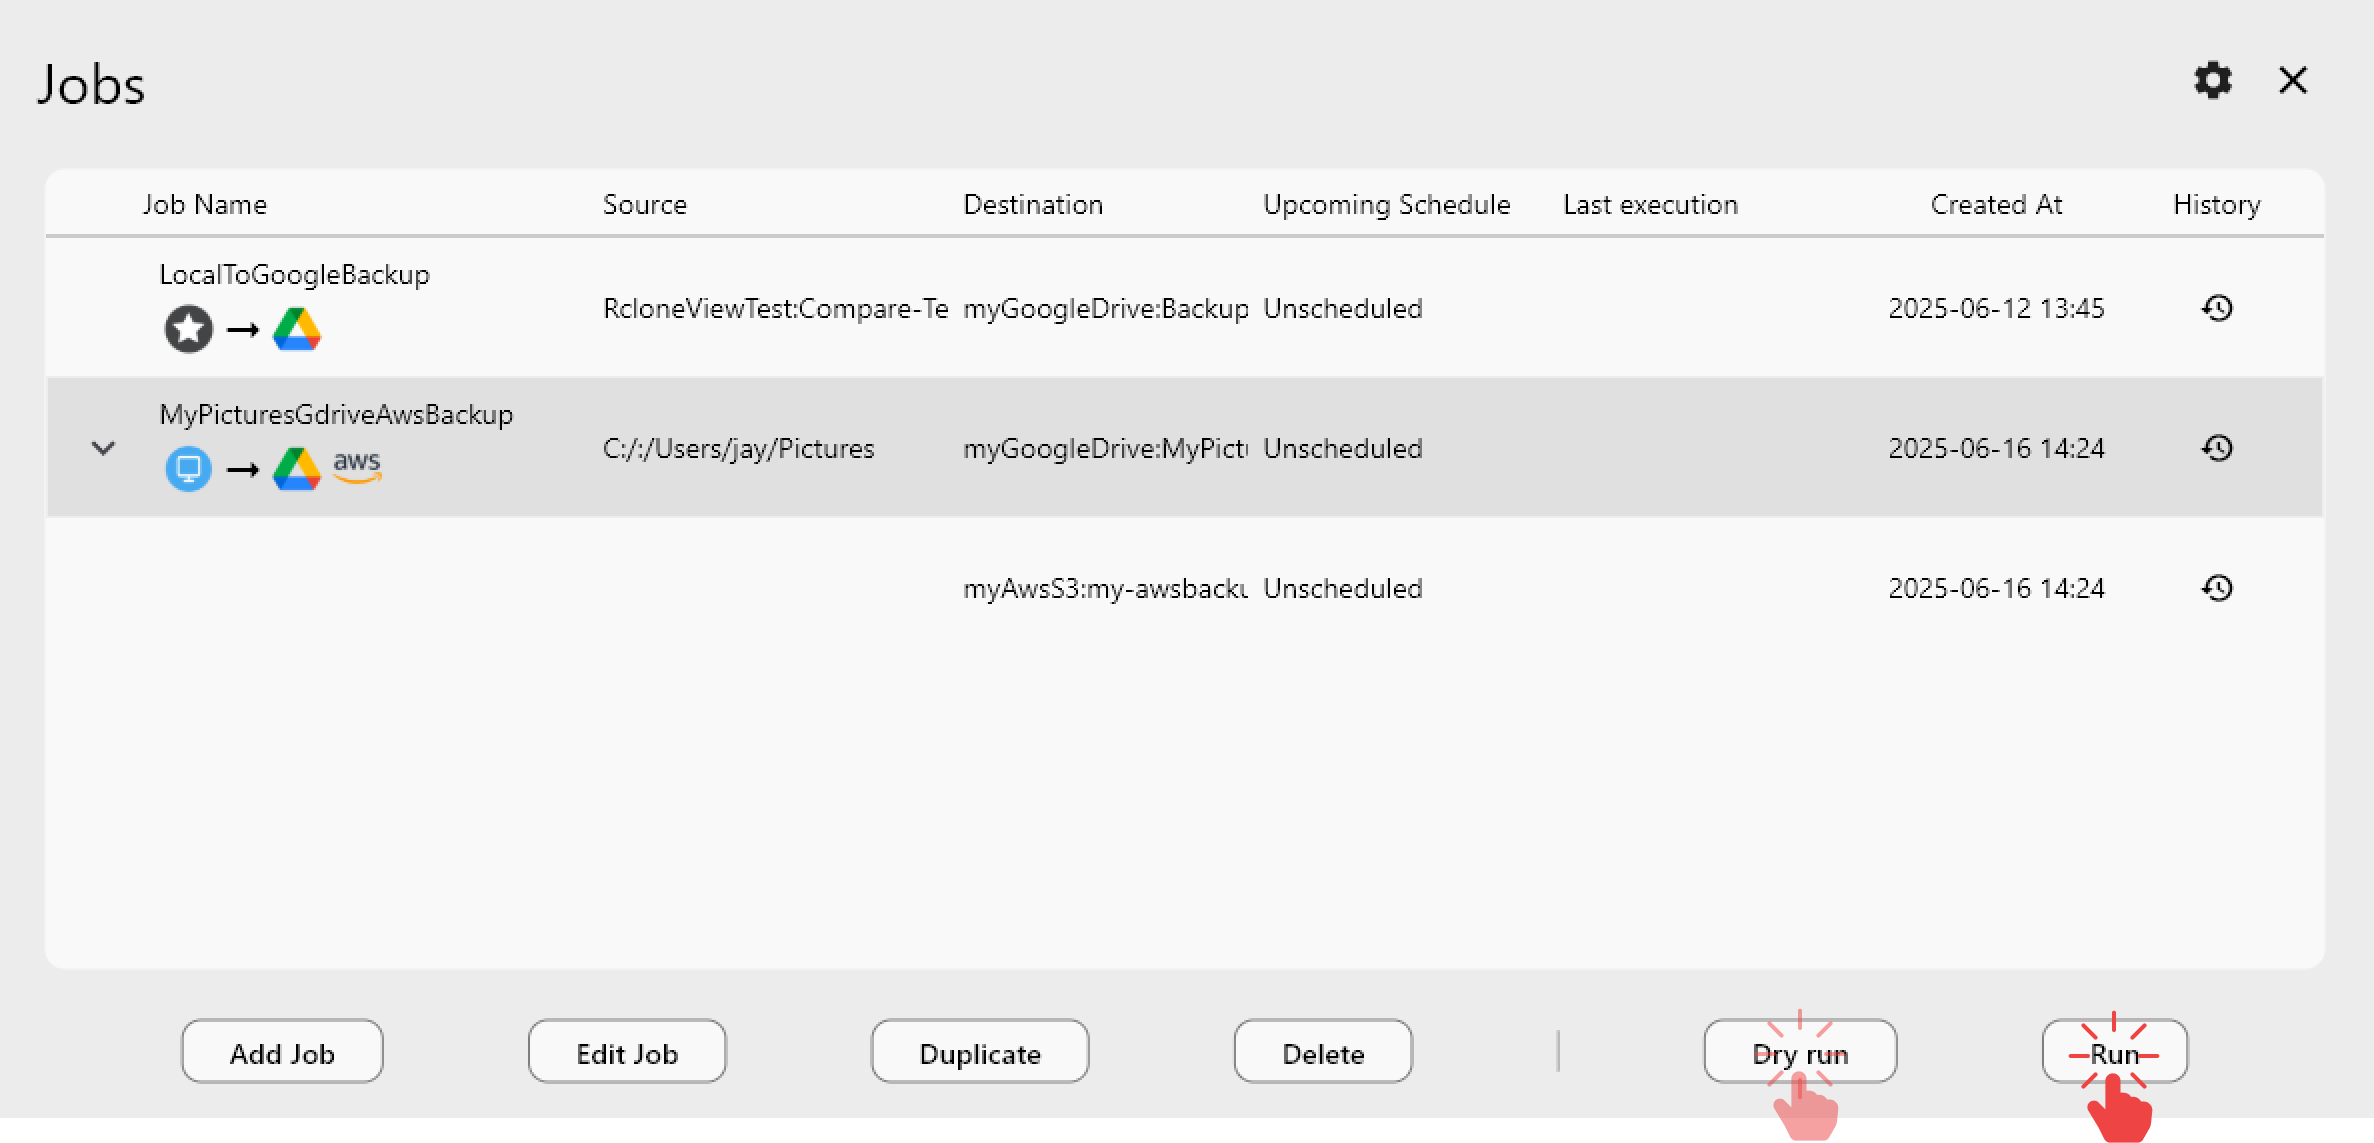
Use the job history view to review past transfers and identify patterns. If certain jobs consistently take longer or fail, those are candidates for tuning.
Quick Reference: Recommended Settings
| Setting | Low-Resource System | Standard System | High-Performance |
|---|---|---|---|
--transfers | 2 | 4 | 8-16 |
--checkers | 4 | 8 | 16 |
--buffer-size | 4M | 16M | 32M |
--vfs-cache-max-size | 512M | 2G | 10G |
--vfs-cache-mode | minimal | writes | full |
Adjust these based on your available RAM, CPU cores, and internet bandwidth. Start conservative and increase gradually.
Getting Started
- Download RcloneView from rcloneview.com.
- Open an existing sync job or create a new one, and review the transfer and checker settings.
- Reduce
--transfersand--checkersif your system struggles during transfers. - For mounted drives, configure VFS cache limits to prevent unbounded memory growth.
Small adjustments to parallelism and cache settings can dramatically improve system responsiveness without significantly impacting transfer speeds.
Related Guides: